AI Crawl Report: OpenAI Surges as ClaudeBot Vanishes
nonsenseo.com shows humans a single title-only page. Its real audience is machines. This week that machine audience split into two numbers that rarely get reported together: 174 crawler requests, and 118 retrievals of our content to build AI answers. Both come from Cloudflare’s AI Crawl Control, and we publish both every week because they answer different questions. Crawls show who is reading the site. Retrievals show who is quoting it.
All crawl numbers below cover October 10 to 16, 2026, pulled from the AI Crawl Control view of Cloudflare’s GraphQL Analytics API. The comparison week is October 3 to 9. Retrieval numbers come from the Optimization tab over the same window.
The week in two numbers
AI crawlers made 174 requests, down 8 percent from 189, and downloaded 459 KB. 165 requests ended cleanly and 9 failed. Humans sent 2,244 requests in the same window, which puts crawlers at about 7 percent of all traffic. On a site built for robots, that was a slow robot week.
The second number lives in a different tab. AI answer systems retrieved our content 118 times, up 42 percent from the week before, and OpenAI’s ChatGPT User agent accounts for essentially all of it. That is not 118 crawls. It is 118 answer builds, and the section below keeps the two measurements apart.
Who crawled us
| Operator | Requests | Successful | Errors | Downloaded |
|---|---|---|---|---|
| OpenAI | 131 | 124 | 7 | 317 KB |
| 32 | 30 | 2 | 105 KB | |
| Amazon | 7 | 7 | 0 | 25 KB |
| Microsoft | 3 | 3 | 0 | 4.7 KB |
| Anthropic | 1 | 1 | 0 | 8.2 KB |
| Perplexity, ByteDance, Huawei, Apple, Meta | 0 | 0 | 0 | 0 |
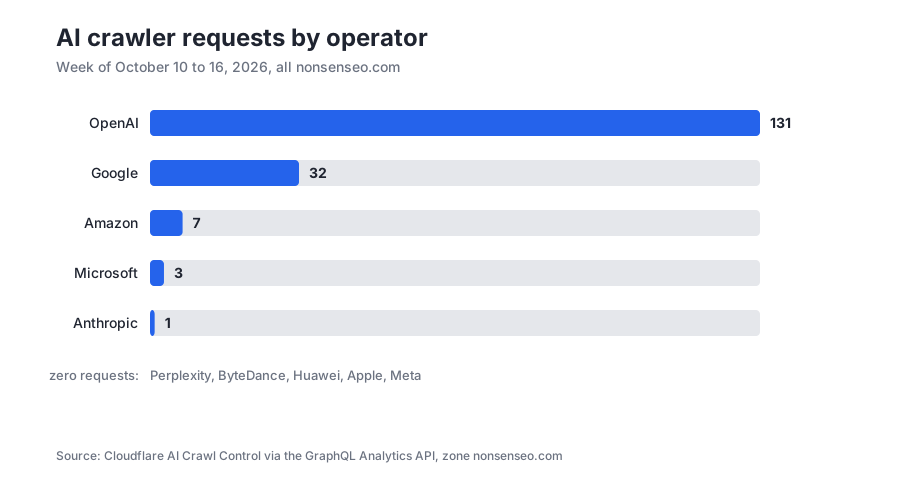
OpenAI took three quarters of the week: 131 of 174 requests. The split inside it matters to anyone tracking AI search. OAI-SearchBot, the search index crawler, did 110 of them, 84 percent of OpenAI’s work. GPTBot, the training crawler, did 18. ChatGPT-User, the agent that fetches a page when someone shares a link into ChatGPT, did 3. Google’s 32 requests were Googlebot 30 and Googlebot-Image 2. Amazonbot covered all 7 of Amazon’s requests and bingbot all 3 of Microsoft’s.
Five known names sent nothing at all: Perplexity, ByteDance, Huawei, Apple, and Meta.
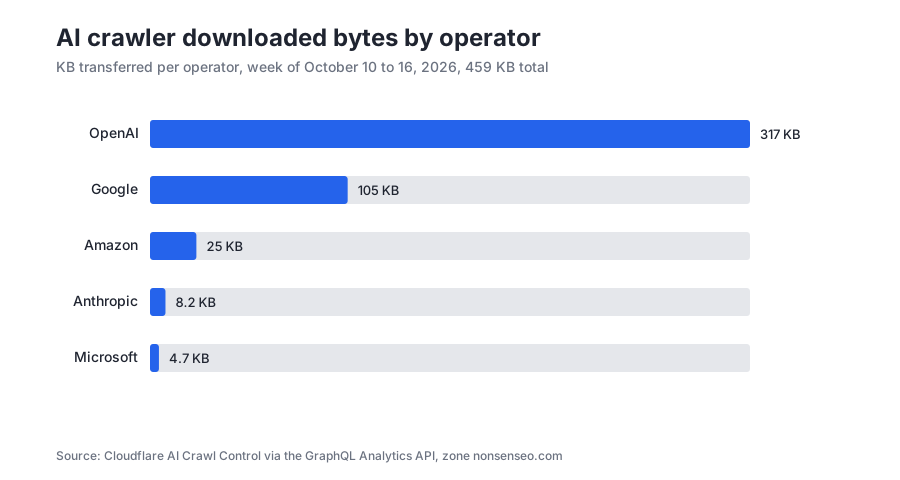
OpenAI also took 69 percent of the bytes
Request counts undersell OpenAI’s week. Its crawlers downloaded 317 of the 459 KB served to AI bots, 69 percent of everything. Google took 105 KB and Amazon 25 KB. The rest was crumbs.
Per request the ordering flips. Anthropic’s single visit averaged 8.2 KB, more than triple OpenAI’s 2.4 KB average. Amazonbot averaged 3.5 KB, Googlebot 3.3 KB, and bingbot a light 1.6 KB per visit.
ClaudeBot’s one-visit week
Last week Anthropic was the loudest thing on this site with 141 requests, more than every other crawler combined. This week it sent 1. OpenAI filled the space it left: 24 requests became 131. Google grew from 17 to 32 while Amazon held at 7 and Microsoft arrived with 3.
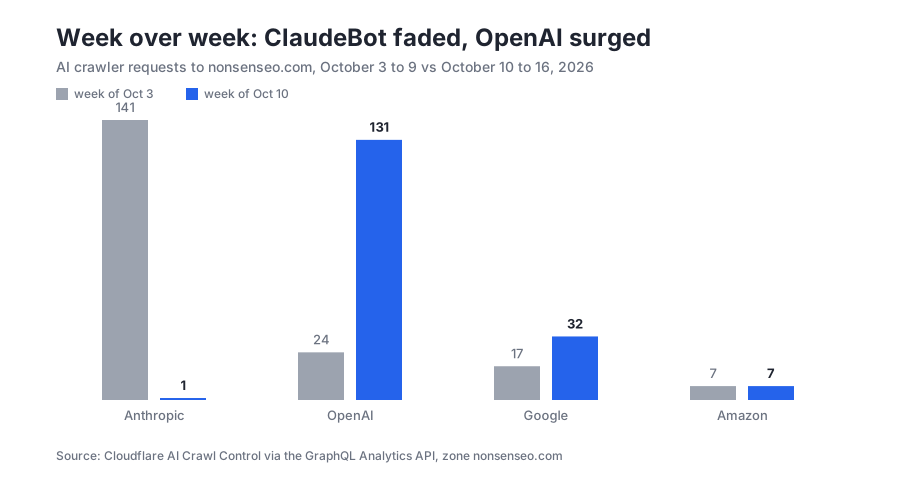
Two readings fit a 141 to 1 collapse. Anthropic finished its crawl cycle and moved on, or it is deliberately backing off after a heavy pull. The one visit we did get downloaded 8.2 KB, which looks like a health check rather than a harvest. Next week’s report settles it.
One version note from inside OpenAI’s traffic: GPTBot now identifies itself as GPTBot/1.4, a string we had not seen before. The crawler appears to be updating itself mid-run.
Quiet days, then a loud Friday
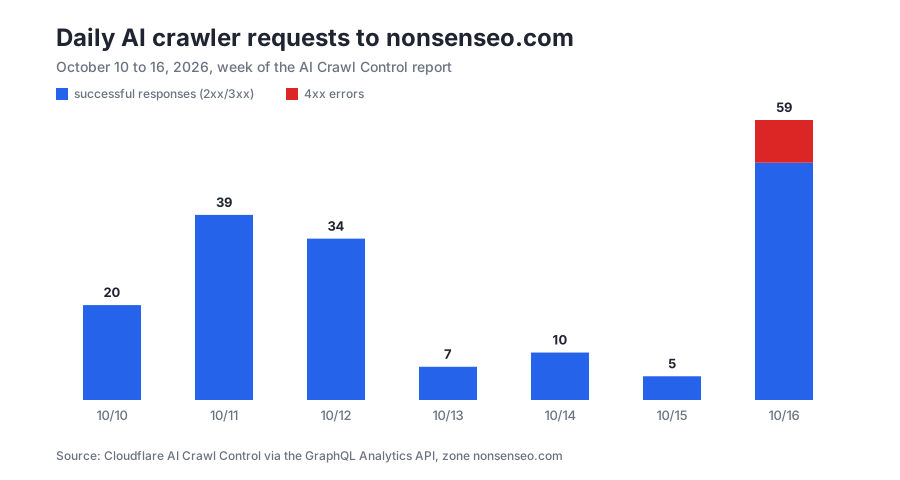
Daily volume wandered between 5 and 39 requests from October 10 through 15, bottoming out at 5 on the 15th. Then Friday the 16th brought 59, including every one of the week’s 9 errors. Whatever tripped the error counter did all of it on one day.
What they asked for
The top path tells you how crawlers read a site. /robots.txt got 60 requests, 55 answered 200 and 5 answered 301. The homepage took 15, /faq 5, /site/ 3, and 3 went to /cdn-cgi/speculation, Cloudflare’s own speculation rules endpoint. /blog/case-study-1 got 2.
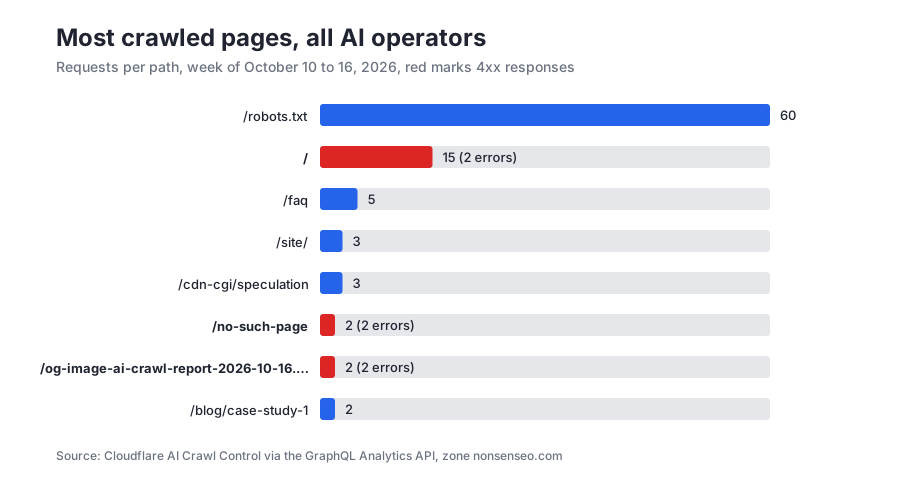
The failures say more than the successes. Two requests hit /no-such-page, which does not exist and never has. Two more asked for /og-image-ai-crawl-report-2026-10-16.png, a file that genuinely should exist, and got 404s. Two homepage requests also landed 404s. Probing for junk paths is normal crawler behavior. The missing og:image was on us, and it is fixed as of this post.
Response codes, bots versus humans
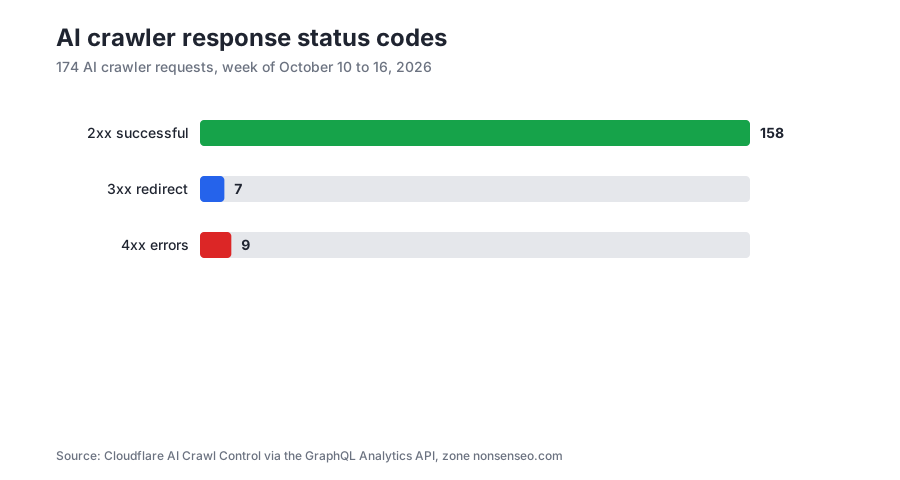
158 of 174 crawler requests ended in 2xx, 7 in redirects, and 9 in errors. The redirects were all robots.txt fetches. OpenAI owns 7 of the 9 errors and Google the other 2.
Humans ran a cleaner race. 1,853 of 2,244 eyeball requests succeeded, 291 redirected, and 100 errored, a 4.5 percent error rate against the crawlers’ 5.2 percent. The robots are not our problem visitors.
The Optimization tab: retrievals are not crawls
The 118 retrievals get their own section because they measure something else. AI Crawl Control’s Optimization tab counts how often our content was pulled into generated AI answers. Its AI Answer volume table credits essentially all of that to OpenAI’s beta ChatGPT User agent: 118 retrievals, up 41 percent.
Now set it beside the crawl log. The ChatGPT-User crawler made 3 raw requests to this site in the same window. Three crawls against 118 retrievals. The crawler fetches pages, the retrievals count answer builds using already fetched content, and the two will never share a chart axis here.
The tab’s other tables round out the picture. 73 unique paths were used in AI answers, with a completely flat tail: every visible top row, /netscape, /products, /iv.php, /admin.php, and /johnson.php, shows a single request. No page dominates. Demand signals, the tab’s name for paths AI assistants tried to reach but could not, counted 6: /cc.php, /HLA-dd.php, /goodie-new.php, /sign-up, and /registration/. That list reads like a scan for old PHP endpoints and signup routes, not a genuine content gap.
How to pull these numbers yourself
The crawl data comes from one GraphQL query against Cloudflare’s httpRequestsAdaptiveGroups dataset, filtered to one crawler user agent at a time. It returns request counts, status codes, and bytes per agent, the same numbers the dashboard shows, in a form you can chart. Cloudflare documents the query API on the AI Crawl Control page.
The Optimization tab works differently. It shipped after Cloudflare’s last GraphQL reference update and has no documented dataset, so we downloaded its tables as CSV and hand-recorded the two summary cards. All retrieval and demand signal counts are as displayed for the 7 days ending October 16, 2026.
Each weekly report compares against the week before, and the whole series lives in the blog.
What we changed because of this report
The og:image that crawlers kept missing now exists at the exact path they requested. That is the loop this report runs on: read what the machines did, fix what they could not get, and publish the numbers so other site owners can compare their own dashboards.
Next week’s report answers two questions: whether ClaudeBot comes back, and whether GPTBot/1.4 sticks.
Quick answers
Which AI crawler sent the most requests this week?
OpenAI, with 131 of 174 requests, about 75 percent. Google was second with 32.
Did ClaudeBot stop crawling nonsenseo.com?
Almost. After 141 requests last week, it sent 1 this week.
How many AI answer retrievals did the site get?
118 for the 7 days ending October 16, 2026, up 42 percent. OpenAI's ChatGPT User agent accounts for essentially all of them.
What path do AI crawlers request most?
/robots.txt, with 60 requests, 55 of them answered with 200. The homepage came second with 15.
How much did AI crawlers download?
459 KB total. OpenAI took 317 KB of it, 69 percent.