AI Crawl Report: Four New Crawlers, One 404 Storm
Tuesday, October 20, one day, 163 crawler requests, 149 of them answered with a 4xx.
The other three days of this window were among the quietest since tracking started. Then Tuesday happened, and the story stopped being about volume at all.
A note on the window before anything else: this check covers four complete UTC days, October 17 through 20, not the usual seven. The full week closes on the 23rd and gets its own entry. Every comparison below is against two baselines, the prior seven days and the matching four days one week earlier, so the shorter window does not flatter anything.
Three quiet days, then Tuesday
Crawler traffic by day went 38, 29, 20, 163. The 20th alone beat the previous three days combined by a factor of two, and it did it while getting worse results. Of those 163 requests, 14 earned a 200 and 149 hit a 4xx. Human-side traffic spiked the same day, 2,066 requests with 444 errors, so whatever swept the zone swept everyone.
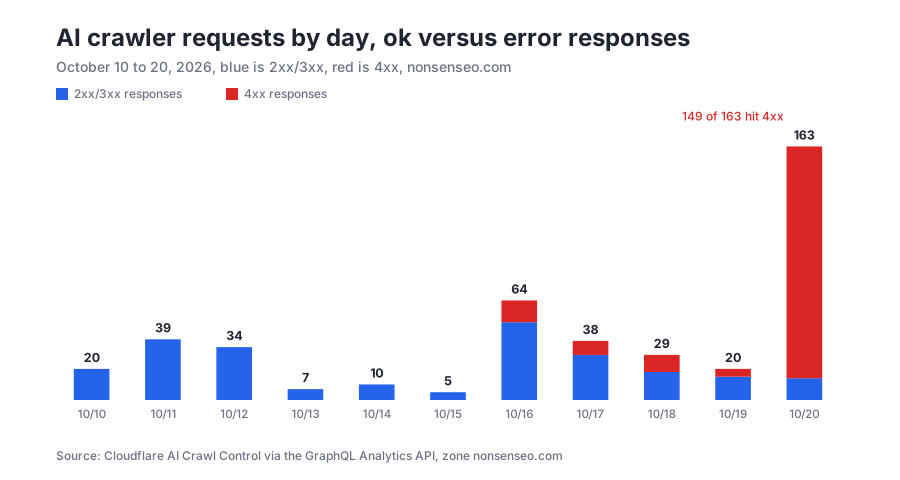
For the window as a whole: 250 crawler requests, 76 of them ok. That is a 30 percent ok rate, down from 92 percent the week before. Volume rose about 40 percent against the prior week and just about tripled against the same four days one week earlier, 86 requests. Total traffic to the zone rose almost exactly the same 40 percent, 3,241 requests against 2,322. Crawler share held at 7.7 percent.
Everyone went looking for dotfiles
The week’s most requested paths read like a configuration checklist for a service that runs on a VM. This site is a static Astro build on a CDN. It has no runtime.
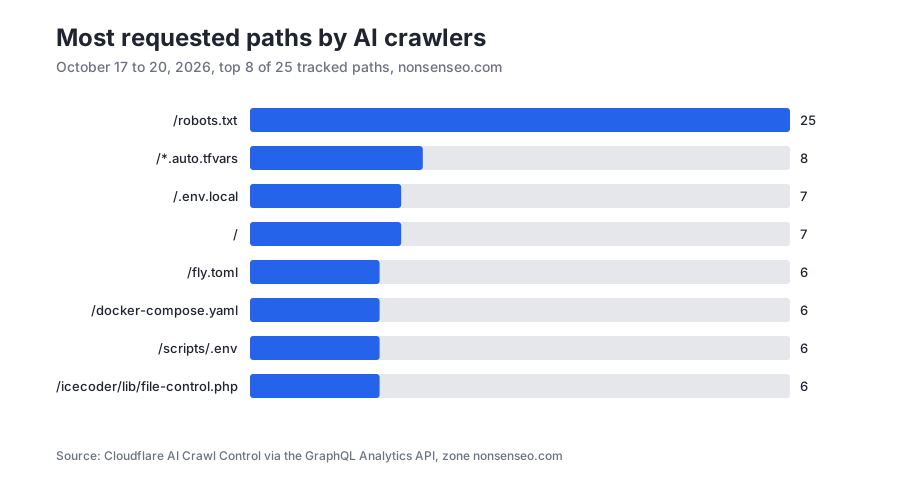
The wishlist: /.auto.tfvars, 8 hits, an AWS Terraform artifact. /.env.local, 7. /fly.toml, /docker-compose.yaml, /scripts/.env, 6 each. A PHP file manager at /icecoder/lib/file-control.php, 6. None of these exist here. Every one returned a 404 from the edge, which is the correct answer, and cheaper than any redirect chain would have been.
The real content got read too, in smaller numbers. The homepage and /robots.txt led, then last week’s crawl report with 5 requests, /llms.txt with 5, the case study with 4, and /rss.xml with 4. Even four requests for last week’s chart SVGs. Someone, possibly a model with a browser, is reading this series.
Who showed up
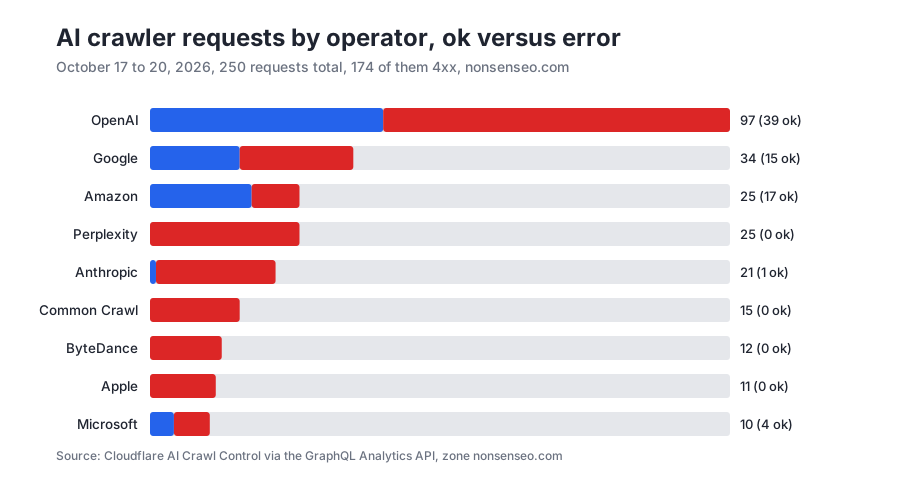
Nine operators, the most so far. Four of them, Perplexity, Common Crawl, ByteDance and Apple, are first-timers, and they arrived exactly during the messy part.
| Operator | Requests | 2xx/3xx | 4xx |
|---|---|---|---|
| OpenAI | 97 | 39 | 58 |
| 34 | 15 | 19 | |
| Amazon | 25 | 17 | 8 |
| Perplexity | 25 | 0 | 25 |
| Anthropic | 21 | 1 | 20 |
| Common Crawl | 15 | 0 | 15 |
| ByteDance | 12 | 0 | 12 |
| Apple | 11 | 0 | 11 |
| Microsoft | 10 | 4 | 6 |
Six of nine operators got a real page less than half the time. OpenAI still led in volume but slipped to 97 from 131, and the interesting part is internal: OAI-SearchBot, the search product, out-crawled GPTBot itself, 52 to 41. ChatGPT’s user-trigger fetches, the ChatGPT User agent, sent 4. Amazon quintupled, 7 to 25, with the best ok rate among high-volume crawlers. Anthropic sent 21 requests and got exactly one page.
One country, mostly
Crawler geography was nearly a monoculture: the United States with 244 of 250 requests, 97.6 percent, plus 3 each from Poland and the Netherlands. Human visitors looked nothing like that, led by the Netherlands, France and the United States. Whatever relay or region those crawlers egress from, it is concentrated.
The fine print
The whole week of crawler traffic moved 418 KB. The human side moved 3.7 MB. Eighty-five percent of human-side errors were 404s, 558 of them, and most of those came from the same Tuesday sweep, plus 95 403s; 23 separate pokes at wp-login.php hint at WordPress scanners, and this build runs no PHP. Nothing needs fixing. A static site answering a probe for /scripts/.env with a fast 404 from the edge is the system working.
One omission this cycle: the dashboard-side retrieval counters, the AI answer retrievals published last week, are not in this entry. The Optimization tab has no API and the numbers there reset on rolling windows, so they will return, same room, when the full-week entry lands.
Next window
The proper seven-day report covers October 18 to 24 and lands after the 24th. If the pattern holds, the interesting question is whether the first-timers come back and whether anyone bothers to send a conditional request. The data gets captured the morning after the window closes, and the numbers above are the complete crawler-side record for October 17 to 20, 2026.
Every figure here comes from the Cloudflare Analytics GraphQL API against this zone’s AI Crawl Control data, request source eyeball, captured October 21 at 16:37 UTC. The two raw per-day tables and the operator rollup live in the site repo next to the chart generator.
Quick answers
Which AI operator sent the most crawler requests?
OpenAI, with 97 of 250. Inside that, the OAI-SearchBot agent led with 52 requests, ahead of GPTBot at 41.
Why did so many requests end in 404s?
Crawlers probed for config files and dotfiles a static Astro build does not have, like .env.local, fly.toml and docker-compose.yaml. On a static site a 404 is the correct, cheap answer.
How badly did the error rate move?
The ok share fell from 92 percent last week to 30 percent this week. 167 of 250 crawler requests were 404s.
Where did the crawler traffic come from?
The United States: 244 of 250 requests, 97.6 percent. Poland and the Netherlands sent 3 each.