AI Crawl Report: 895 Crawls, 704 Dead Ends
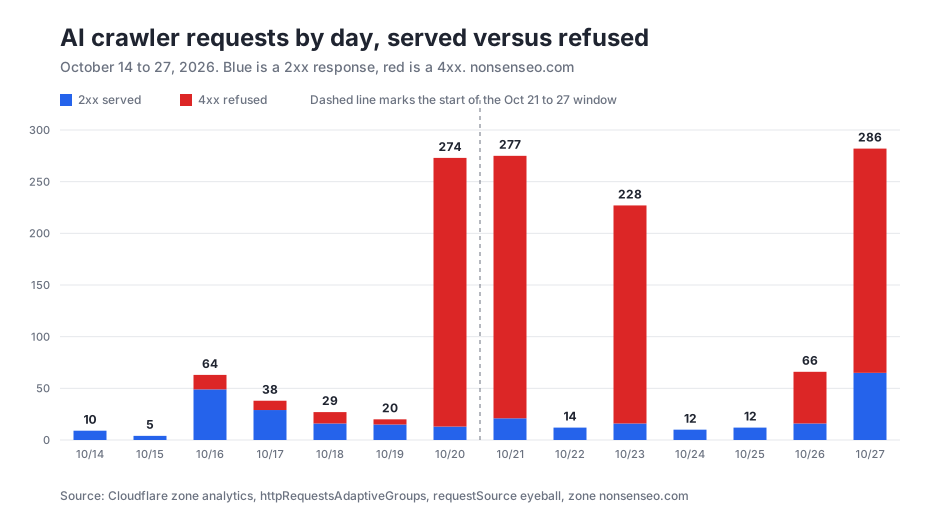
Wednesday, October 21: 277 crawler requests. Thursday, October 22: 14. Friday: 228. Saturday and Sunday: 12 each. Monday: 66. Tuesday, October 27: 286.
That adds up to 895 crawler requests over seven days, and 704 of them were answered with a 404. That is 78.7 percent of the swarm hitting a wall.
The volume matters less than the shape. These crawlers no longer trickle in through the week. They arrive in waves, two days apart, and they spend most of a wave asking for files this site has never had.
The bursts line up with human traffic
The quiet days were quiet on both sides of the wall. Human and non-crawler traffic ran 871 requests on October 21, 175 on the 22nd, 694 on the 23rd, 127 on the 24th, 413 on the 25th, 426 on the 26th and 874 on the 27th.
Total eyeball traffic for the window was 3,580 requests. Crawler traffic was 895 of that, or 25.0 percent.
The prior seven days, October 14 through 20, ran 4,317 total requests with 440 from crawlers, or 10.2 percent. So overall traffic fell 17 percent while crawler traffic rose 103 percent. The bots roughly doubled their share of a smaller pie, and they did it in bursts rather than steady drips.
Bytes tell the same story from the other side. The 895 crawler requests pulled 0.94 MB, because 704 of them ended at a 404 that returns almost nothing. A served page costs bandwidth. A refused path costs a few hundred bytes.
Who was in the swarm
41 distinct user agent strings showed up across 16 operators. All 16 were already on the list the week before, so this was not new entrants. It was the same crowd, arriving harder.
| Operator | Requests | 2xx | 4xx | 3xx |
|---|---|---|---|---|
| OpenAI | 230 | 42 | 188 | 0 |
| 138 | 81 | 46 | 11 | |
| Anthropic | 67 | 0 | 67 | 0 |
| Meta | 64 | 0 | 64 | 0 |
| Amazon | 50 | 14 | 36 | 0 |
| Perplexity | 48 | 2 | 46 | 0 |
| ByteDance | 44 | 3 | 41 | 0 |
| Apple | 43 | 0 | 43 | 0 |
| You.com | 37 | 1 | 36 | 0 |
| DeepSeek | 33 | 1 | 32 | 0 |
| Cohere | 29 | 0 | 29 | 0 |
| Common Crawl | 25 | 2 | 23 | 0 |
| Microsoft | 25 | 4 | 21 | 0 |
| Alibaba | 24 | 0 | 24 | 0 |
| xAI | 21 | 0 | 21 | 0 |
| DuckDuckGo | 17 | 2 | 15 | 0 |
| Total | 895 | 152 | 732 | 11 |
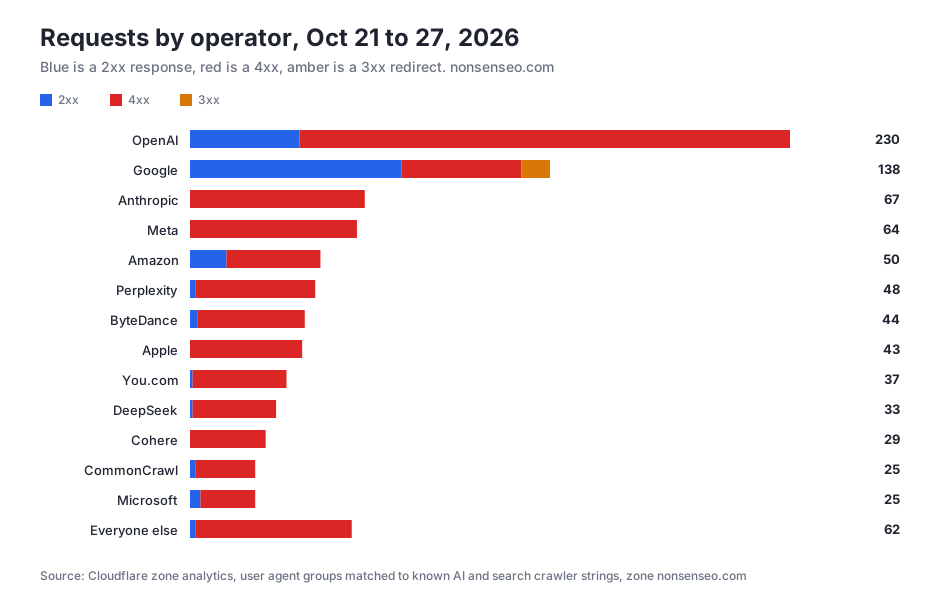
Google is the outlier. 81 of its 138 requests got a real page, because Googlebot fetches robots.txt, the sitemap index and actual URLs instead of guessing at config files. Its Android Googlebot string got 26 of 27 answered.
OpenAI sent the most and read the least in proportion. 42 of 230 requests were answered, and most of those came from ChatGPT-User strings fetching real pages. OAI-SearchBot sent 95 requests on its own and got zero 2xx responses. GPTBot’s two strings sent 15 and got 12 answered.
Anthropic, Meta, Apple, Cohere, Alibaba and xAI each finished the week with zero 2xx responses. Every request from those six operators ended in a 4xx or a 3xx. That is not a fault on their side. It is a fault on this site’s side in the sense that it ships almost no paths they are looking for.
What they were asking for
The most requested path was /robots.txt, at 56 requests. That one is legitimate and mostly answered: 46 got a 200, 8 got a 301, and 2 got a 429. /sitemap-index.xml got 12 requests and 12 answers.
After that the list turns into a tour of infrastructure this site does not run:
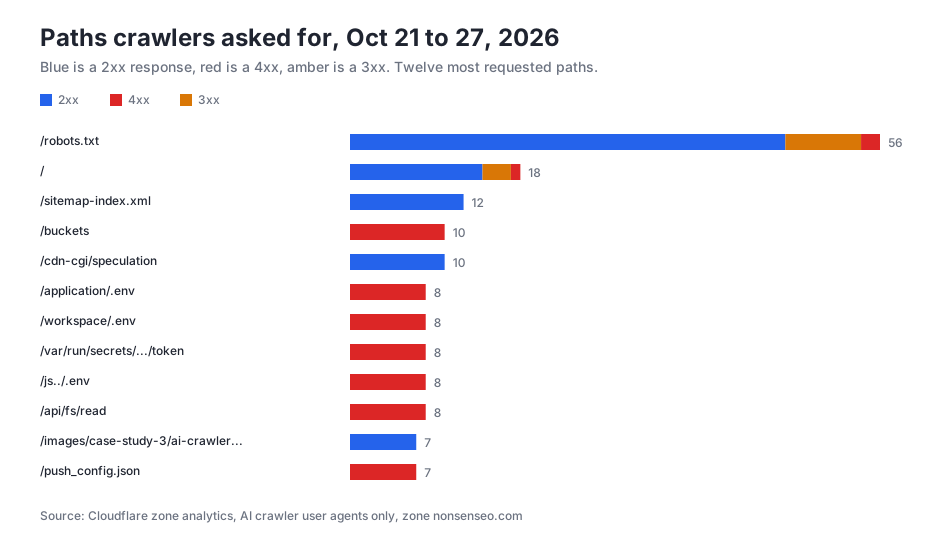
/buckets, 10 requests, 10 404s/application/.env, 8 requests, 8 404s/workspace/.env, 8 requests, 8 404s/var/run/secrets/kubernetes.io/serviceaccount/token, 8 requests, 8 404s/js../.env, 8 requests, 8 404s/api/fs/read, 8 requests, 8 404s/push_config.json, 7 requests, 7 404s/.idea/WebServers.xml, 7 requests, 7 404s/.env, 7 requests, 7 404s
Those paths are the fingerprints of whatever host the crawler last indexed. /application/.env is a Ruby or Rails convention. /workspace/.env looks like a CI checkout. The Kubernetes service account token path is a container probe that wandered onto a public zone. /api/fs/read reads like someone’s internal file API leaking into a crawl queue.
None of them exist here, and none of them should. A static Astro build ships HTML, a sitemap and a handful of images. Every one of those probes costs a 404 response of a few hundred bytes and nothing else.
The edge started refusing
This is the first week where the zone itself pushed back. 21 requests got a 403 and 7 got a 429, including two 429s on /robots.txt.
That is new. Previous weeks ran at 0 or near 0 throttling. When a burst arrives, Cloudflare’s rate limiting kicks in and some crawlers get a hard no instead of a 404. It also means a crawler that respects 429 backoff will retry later, which is why the next burst tends to look bigger.
The 403s are the more interesting half. Those come from rules, not volume. Something in the path or the request shape tripped a rule and got refused before it reached the origin.
What this week says about the site
The site is not broken. A 404 for /application/.env is the correct answer, and the crawl budget spent on it is trivial: 895 requests moved under a megabyte.
What the numbers do show is that crawler attention is not the same as crawler reading. 152 of 895 requests got content, 17.0 percent. Last week it was 135 of 440, or 30.7 percent. More traffic, worse hit rate, and the operators that never read anything are the ones sending more.
The one lever that actually moved the served share was Googlebot’s own behavior, not anything this site changed.
On the window
The October 20 entry said the next full week would cover October 18 through 24. This entry covers October 21 through 27 instead, because the 18th, 19th and 20th were already reported in that earlier entry. Counting them twice would inflate both weeks. The comparison baseline is the seven days before the window, October 14 through 20, so the numbers stay like for like.
All figures come from Cloudflare zone analytics for nonsenseo.com, httpRequestsAdaptiveGroups with requestSource: eyeball, pulled on October 28, 2026 at 03:10 UTC. Crawler rows are matched on known AI and search crawler user agent strings, case-insensitive, across 41 distinct strings.
Retrieval counts live in the AI Crawl Control dashboard and are not exposed through zone analytics GraphQL, so this entry reports the crawler side only. The crawler side is the half that has hard numbers.
What to watch next
The burst spacing is the thing to track. Waves landed on the 21st, 23rd, 26th and 27th, with two-day gaps and then two consecutive days. If the pattern holds, the next window should show whether the gaps shorten or whether the edge’s new 429s actually slow the retries down.
One number worth watching closely: how many of the 41 agent strings come back with a 200 instead of a 404. Right now it is a small minority, and that is the only number that says whether the site is being read or just being searched.
Quick answers
How many AI crawler requests did nonsenseo.com get in the week of October 21 to 27, 2026?
895 requests from 41 distinct crawler user agents across 16 operators. 704 of those requests returned a 404, 21 returned a 403, 7 returned a 429, and 152 returned a 2xx.
Which AI operator sent the most crawler requests that week?
OpenAI, with 230 of 895 requests. Its OAI-SearchBot string sent 95 on its own and got zero 2xx responses. Google was second at 138 and was the only operator with a majority of requests answered, at 81 of 138.
Why do so many AI crawlers get 404s on a static site?
They probe for files a static Astro build does not ship: application/.env, workspace/.env, js../.env, push_config.json, buckets, and the Kubernetes service account token path. A 404 is the correct and cheap answer for a path that never existed.
Did Cloudflare rate limit the crawlers?
Yes, for the first time on this zone. Seven requests got a 429, two of them on robots.txt, and 21 got a 403. Those 28 refusals are the edge pushing back rather than the site being broken.