AI Crawl Report: 444 Crawls, 272 Dead Ends, One Quota Wall
Two things happened on this zone in the same week. On October 28 and 29 the site returned 429 to 252 requests because the Cloudflare account ran out of Workers allowance. On November 1 a single audit scanner sent 1,927 requests, and 2,106 requests landed in one hour.
AI crawler volume went down. Total traffic went up. Those are not contradictory when scanners are involved.
On the window
Six complete UTC days: October 28 through November 2, 2026. November 3 was still running when this was captured, so it is excluded. The comparison window is the six days before, October 22 to 27.
The October 27 report covered seven days and counted 895 crawler requests. That figure is not a like-for-like baseline for this post. The same-length baseline for the AI and search crawler set is 695 requests in October 22 to 27, and 444 in this window.
Requests by day
| Date | Total | 2xx | 3xx | 404 | 429 | 403 |
|---|---|---|---|---|---|---|
| 2026-10-28 | 296 | 58 | 13 | 18 | 183 | 24 |
| 2026-10-29 | 186 | 77 | 23 | 16 | 69 | 1 |
| 2026-10-30 | 234 | 192 | 11 | 30 | 0 | 1 |
| 2026-10-31 | 622 | 495 | 91 | 32 | 0 | 4 |
| 2026-11-01 | 2,983 | 1,813 | 728 | 408 | 0 | 34 |
| 2026-11-02 | 1,391 | 1,167 | 165 | 43 | 0 | 16 |
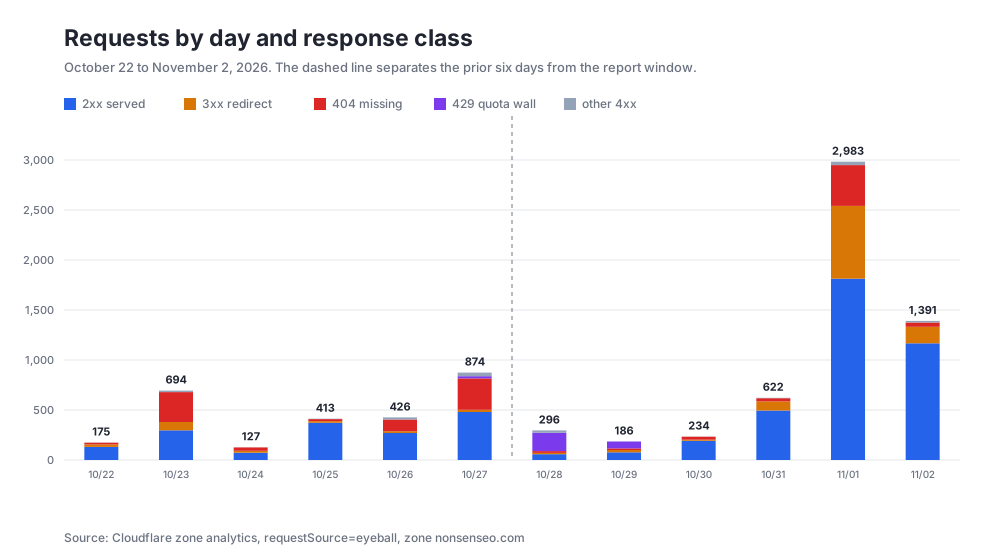
October 28 and 29 are the quota wall. November 1 is the scanner. October 23, inside the comparison window, was the previous scanner day at 694 requests.
The scanner storm
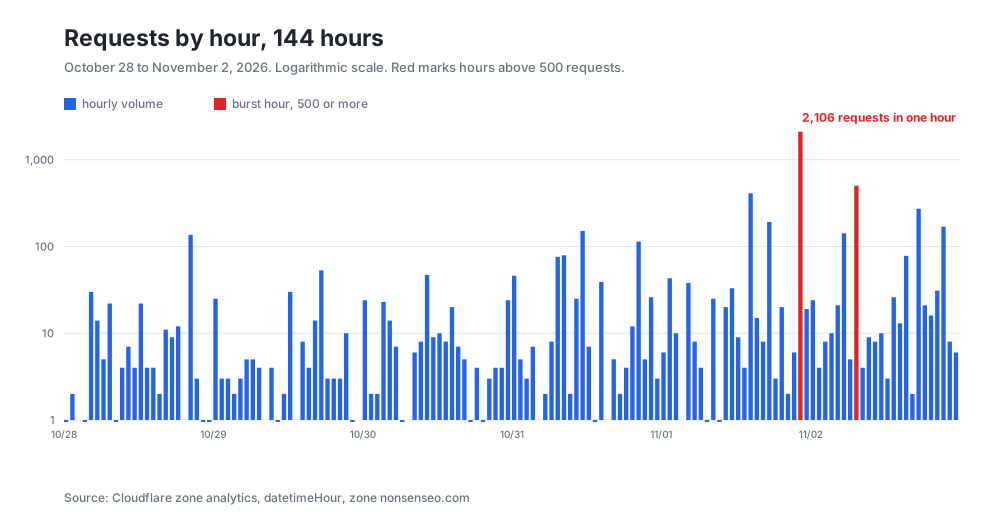
1,927 of the 5,712 requests came from one client: TLM-Audit-Scanner/2.0. That is 34 percent of the week from a single auditor. The 22:00 UTC hour on November 1 alone carried 2,106 requests, and 2,105 of them were not crawlers.
The rest of the scanner pile is smaller but just as noisy. l9scan sent 79 requests, Go-http-client 52, WP-Safe-Scanner 48, and Palo Alto Cortex Xpanse 38. Another 745 requests carried a plain Chrome 131 user agent with no bot marker, which is either a real browser or something wearing one as a costume.
Methods tell the same story. 5,597 requests were GET, 18 were HEAD, 5 were OPTIONS, and 92 were POST. A static blog has no reason to see 92 POSTs.
Host headers show port sweeps too. 60 requests arrived on :8443, 30 on :443, 6 on :80, and one each on :2086 and :2087. TLS scanners knock on every door they find.
What the quota wall cost
252 requests got 429, all of them on October 28 (183) and October 29 (69). Error 1027 is what Cloudflare returns when an account exhausts its daily Workers request limit. On the Free plan that limit is 100,000 requests per day for the whole account, shared across every zone. A sibling zone consumed the allowance, and this zone answered with refusals.
The crawlers barely noticed. Only 17 of the 252 refusals went to AI crawlers, and 6 of those went to GPTBot. Most of the 429s hit browsers, monitors, and the scanner. What crawlers got instead was 404.
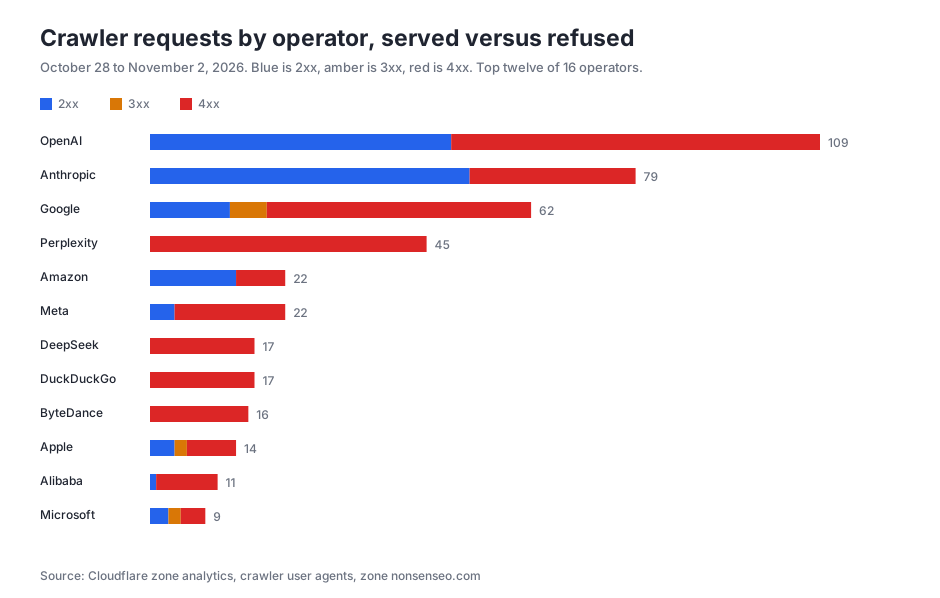
Crawlers: 444 requests, 272 dead ends
| Operator | Requests | 2xx | 3xx | 404 | 429 | 403 |
|---|---|---|---|---|---|---|
| OpenAI | 109 | 49 | 0 | 54 | 6 | 0 |
| Anthropic | 79 | 52 | 0 | 27 | 0 | 0 |
| 62 | 13 | 6 | 38 | 4 | 1 | |
| Perplexity | 45 | 0 | 0 | 42 | 0 | 3 |
| Meta | 22 | 4 | 0 | 15 | 3 | 0 |
| Amazon | 22 | 14 | 0 | 4 | 4 | 0 |
| DeepSeek | 17 | 0 | 0 | 17 | 0 | 0 |
| DuckDuckGo | 17 | 0 | 0 | 17 | 0 | 0 |
| ByteDance | 16 | 0 | 0 | 16 | 0 | 0 |
| Apple | 14 | 4 | 2 | 8 | 0 | 0 |
| Alibaba | 11 | 1 | 0 | 10 | 0 | 0 |
| Microsoft | 9 | 3 | 2 | 4 | 0 | 0 |
| You.com | 9 | 1 | 0 | 8 | 0 | 0 |
| Cohere | 5 | 0 | 0 | 5 | 0 | 0 |
| Common Crawl | 5 | 0 | 0 | 5 | 0 | 0 |
| xAI | 2 | 0 | 0 | 2 | 0 | 0 |
272 of 444 crawler requests returned 404. That is 61 percent. Only 141 were served, and 10 were redirects.
OpenAI led volume at 109 and got 54 misses. Perplexity sent 45 requests and got zero successful reads, 42 misses and 3 refusals. DeepSeek, DuckDuckGo, ByteDance, Cohere, Common Crawl, and xAI sent nothing but 404s.
SEO crawlers behaved differently and are counted separately. Semrush sent 25 requests, Ahrefs 34, Huawei 58, Majestic 2, Baidu 10. 115 of those 129 were served with 200, because those bots ask for pages that exist.
What they asked for
1,420 unique paths were requested in six days. 491 of them were requested exactly once, which is 35 percent of the set. Those are guesses, not visits.
| Path | Requests | Response |
|---|---|---|
| / | 491 | 2xx and 3xx |
| /robots.txt | 120 | 2xx |
| /appsettings.Local.json | 45 | 200 |
| /favicon.ico | 36 | 2xx |
| /.git/config | 32 | 404 |
| /config.json | 31 | 404 |
| /.env | 30 | 200 |
| /sitemap-index.xml | 27 | 2xx |
| /wp-login.php | 27 | 404 |
| /client/.env | 26 | 200 |
879 requests got a 4xx. Grouped by the file type in the requested path: 259 had no extension, 234 asked for env files across 112 distinct paths, 133 asked for XML files, 81 for JSON, 33 for YAML, 27 for txt, 22 for PHP, and 82 fell outside those buckets.
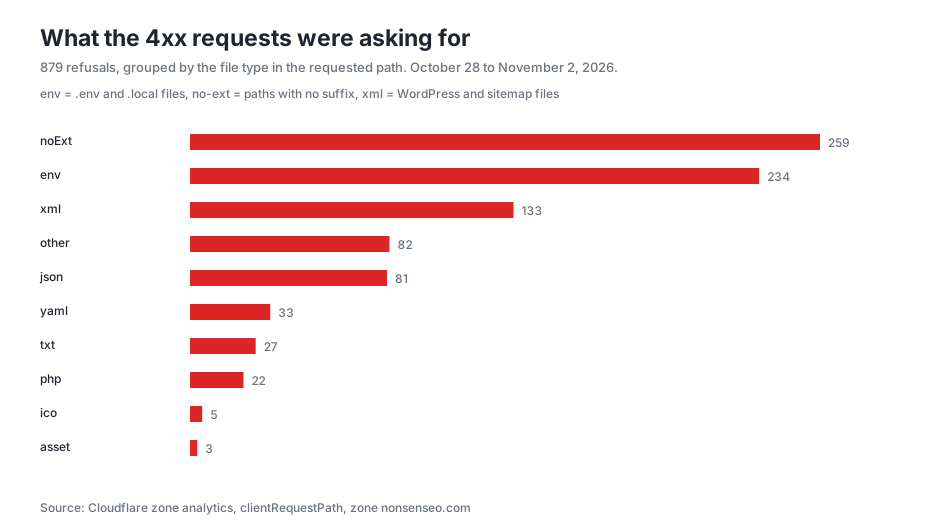
348 of those 4xx responses were config-file guesses (env, json, yaml). Another 133 were WordPress files, mostly /wordpress/wp-includes/wlwmanifest.xml and its nested variants. This is a static Astro site. It has never shipped WordPress.
The soft 404 problem
/appsettings.Local.json was requested 45 times and answered 200 on 44 of them. The file does not exist. /.env was requested 30 times and answered 200 every time.
Then /.git/config got 32 requests and returned 404, and /.changeset/config.json got 20 and returned 404.
So the routing layer answers some nonexistent paths with a 200 and the shell page, and other nonexistent paths with a 404. A crawler cannot tell which paths are real, and a scanner learns nothing from either answer. That inconsistency is the single cheapest thing to fix on this site.
Nothing was cached
Every one of the 5,712 requests reported cacheStatus none. Nothing came from the edge cache, so every request reached the Worker. Total response volume was 7.2 MB, of which AI crawlers took 730 KB, about 10 percent.
That is the mechanism behind the quota event. A scanner that sends 1,927 requests consumes 1,927 Worker invocations, and there is no cache in front of them.
Ports and methods
GET accounted for 5,597 requests. POST accounted for 92, HEAD for 18, and OPTIONS for 5. A static blog has no reason to see 92 POSTs, and those came from scanners testing whether the site accepts a body.
The host dimension shows port sweeps: 60 requests to :8443, 30 to :443, 6 to :80, and 1 each to :2086 and :2087.
robots.txt and the controls
120 requests asked for /robots.txt. The zone’s rule set is one line of intent: allow everything for every user agent, no disallow entries, and a declared sitemap at https://nonsenseo.com/sitemap-index.xml.
That is the only AI Crawl Control surface the API exposes on this zone. A GET to /zones/{zone}/ai-audit/robots returns the user agent map and sitemap list, and nothing else. There are no per-agent rules to inspect, no block list to argue with. The site is open to machines by design, and the only thing standing between a crawler and the content is the Worker.
What the dashboard shows and the API does not
Zone analytics stops at request-level fields. The AI Crawl Control dashboard goes further, and some of it exists nowhere else. Both views below were read from the dashboard on November 4, 2026, on this zone.
Seven day view, by agent and bytes served:
| Agent | Requests | Bytes |
|---|---|---|
| PetalBot (Huawei) | 55 | 237.04 kB |
| ClaudeBot (Anthropic) | 55 | 84.71 kB |
| Amazonbot | 24 | 186.51 kB |
| GPTBot (OpenAI) | 22 | 195.94 kB |
| Googlebot | 11 | 52.54 kB |
| Seven more agents | 19 | 69.92 kB |
The dashboard total for that window is 758 requests, 187 allowed and 571 unsuccessful. Status split: 184 200s, 3 redirects, 8 403s, 553 404s and 10 429s. Across 51 distinct paths, the busiest is /sitemap-index.xml at 35 requests and 24.53 kB, then /blog/case-study-5/ at 12, / at 9, /sitemap-0.xml at 7 and /blog/ at 7.
The dashboard also counts more agents than the 16 operator set used in this report. Claude-User, OAI-SearchBot, DuckAssistBot, Perplexity-User, Baidu, MistralAI-User, Meta-ExternalAgent and Manus Bot all appear in its access list, and its seven day window runs to November 4, not November 2. The totals are therefore not comparable with the 444 figure above. Use the API numbers for the October 28 to November 2 window and the dashboard for per-agent detail.
That per-agent detail is the part worth sitting with. Twenty-four hour view, allowed against unsuccessful:
| Agent | Allowed | Unsuccessful |
|---|---|---|
| PetalBot | 6 | 0 |
| ClaudeBot | 15 | 25 |
| Claude-SearchBot | 0 | 30 |
| DuckAssistBot | 0 | 26 |
| Googlebot | 3 | 42 |
| Amazonbot | 10 | 15 |
| Bytespider | 1 | 24 |
| OAI-SearchBot | 0 | 24 |
| Claude-User | 0 | 23 |
| BingBot | 1 | 21 |
| ChatGPT-User | 0 | 19 |
| Applebot | 0 | 18 |
| CCBot | 3 | 15 |
| Baidu | 0 | 15 |
| Perplexity-User | 0 | 13 |
| PerplexityBot | 0 | 12 |
| GPTBot | 3 | 9 |
Every retrieval-style agent on that list, meaning Claude-SearchBot, OAI-SearchBot, DuckAssistBot, ChatGPT-User, Claude-User and Perplexity-User, finished the day with zero successful requests. They are the agents a person talks to, and they are the ones a site most wants to serve. One day is a small sample and the ranking should be read as directional, but the direction is consistent with the 404 census in this report: agents land on guessed paths, get a dead end and leave.
One more gap. The dashboard’s content format panel reports 0 matched and 0 unmatched responses and states that no content format data is available. That is because the markdown negotiation on this site is a Pages Function written by hand, not the Cloudflare Markdown for Agents feature, which sits behind the Pro plan. Cloudflare counts what it does. Ours it cannot see.
What changed this week
Measurement, not policy. This report adds hourly request volume, HTTP method, host port, response bytes, a full path census with single-hit counts, 4xx grouped by guessed file type, cache status, and the live robots.txt and AI Crawl Control configuration.
One thing Cloudflare still will not give us on this plan is referer host. The GraphQL API rejects clientRefererHost for this zone, so AI referral traffic, meaning the humans who arrive from ChatGPT or Perplexity, stays invisible in zone analytics. Retrieval counts in the AI Crawl Control dashboard are also dashboard-only, because no zone analytics dataset exposes them.
FAQ
How many AI crawler requests did nonsenseo.com get between October 28 and November 2, 2026? 444 requests across 16 AI and search operators. 272 returned 404, 141 returned 2xx, 17 returned 429, 4 returned 403, and 10 were redirects. The previous six days carried 695 crawler requests, so volume fell 36 percent.
Why did crawler traffic fall while total traffic doubled? Because the extra traffic was not crawlers. TLM-Audit-Scanner/2.0 sent 1,927 of the 5,712 requests, including 2,106 requests in the 22:00 UTC hour on November 1. Crawler volume fell over the same window.
What caused the 429 responses on this site? The Cloudflare account hit its shared daily Workers request allowance. On the Free plan that is 100,000 requests per day across every zone on the account, and a sibling zone consumed most of it. This zone returned 429 to 183 requests on October 28 and 69 on October 29. Only 17 of those went to AI crawlers.
What new metrics does this report add compared with earlier crawl reports? Hourly request volume, HTTP method, host port, response bytes, a full census of requested paths, 4xx responses grouped by guessed file type, cache status, and the live robots.txt and AI Crawl Control configuration. Referer host is still unavailable because the GraphQL API rejects clientRefererHost on this zone’s plan.
How this was measured
Cloudflare GraphQL zone analytics, dataset httpRequestsAdaptiveGroups, filter requestSource eyeball, zone nonsenseo.com, window 2026-10-28T00:00:00Z to 2026-11-03T00:00:00Z. Crawler classification is by user agent token using the same 16-operator set as the October 27 report, with SEO and legacy search crawlers counted separately. The raw capture for every figure in this post is in scripts/data/ai-crawl-control-window-2026-10-28-11-02.json. Per-agent access detail, byte counts and path rankings come from the AI Crawl Control dashboard on this zone, read on November 4, 2026, because the zone analytics API does not expose them.
Quick answers
How many AI crawler requests did nonsenseo.com get between October 28 and November 2, 2026?
444 requests across 16 AI and search operators. 272 returned 404, 141 returned 2xx, 17 returned 429, 4 returned 403, and 10 were redirects. The previous six days carried 695 crawler requests, so volume fell 36 percent.
Why did crawler traffic fall while total traffic doubled?
Because the extra traffic was not crawlers. A single audit scanner, TLM-Audit-Scanner/2.0, sent 1,927 of the 5,712 requests, including 2,106 requests in the 22:00 UTC hour on November 1. Crawler volume fell over the same window.
What caused the 429 responses on this site?
The Cloudflare account hit its shared daily Workers request allowance. On the Free plan that is 100,000 requests per day across every zone on the account, and a sibling zone consumed most of it. This zone returned 429 to 183 requests on October 28 and 69 on October 29. Only 17 of those went to AI crawlers.
What new metrics does this report add compared with earlier crawl reports?
Hourly request volume, HTTP method, host port, response bytes, a full census of requested paths, 4xx responses grouped by guessed file type, cache status, and the live robots.txt and AI Crawl Control configuration. Referer host is still unavailable because the GraphQL API rejects clientRefererHost on this zone's plan.
Why do the dashboard and the API disagree on crawler counts?
They measure different windows and different agent lists. The dashboard view used here runs seven days to November 4 and tracks 31 agents, including Claude-User, OAI-SearchBot, DuckAssistBot and Perplexity-User. The API figures in this report cover October 28 to November 2 and a 16 operator set. The dashboard is the right source for per-agent status detail, and the API is the right source for the window total.